


Flash Note
3 min
A summer hangover?

Any way you cut it, the Banks have had a pretty good run. After bottoming in mid 2023, the Banks have outperformed the market by around 20%* and if anything that outperformance has accelerated into the first few months of this year. The reasons for that outperformance aren’t overly clear: only CBA reported full financial results in the recent February reporting season and those results were pretty underwhelming. At a pre provision profit level CBA actually missed consensus expectations, with the bottom line result saved in our view by a low credit charge.
There have been some reports of foreign buying of the Banks, particularly by Asian investors searching for ‘anything but China’. You can see why big, liquid Aussie Banks fit the bill here, particularly given Australian Resource stocks are generally considered a leveraged play on China.
Over the past year our portfolios have held overweight positions in ANZ, NAB and Westpac. Our thesis over this period was premised on sensible earnings forecasts and reasonable valuations, particularly when compared to many Industrial stocks. At the time we (and consensus) were forecasting lacklustre credit growth, ongoing Net Interest Margin (NIM) compression, growing costs and a modest credit cycle. Not surprisingly, those assumptions drove limited earnings growth and hence forecast total return was largely limited to the grossed-up dividend yield.
While that earnings profile didn’t look very exciting, in our view valuations were very reasonable. A year ago ANZ and Westpac were trading around book value or 10x forward earnings. On a bad day they even traded below book! NAB was slightly more expensive, but still well below the premium rating enjoyed by CBA.
Finally, market sentiment towards the Banks was terrible. This peaked after the May 2023 Bank ‘Reporting Season’ when NIMs were being crushed in the midst of a mortgage pricing war. Brokers were universally bearish and even Bank management teams we saw at the time were quite concerned.
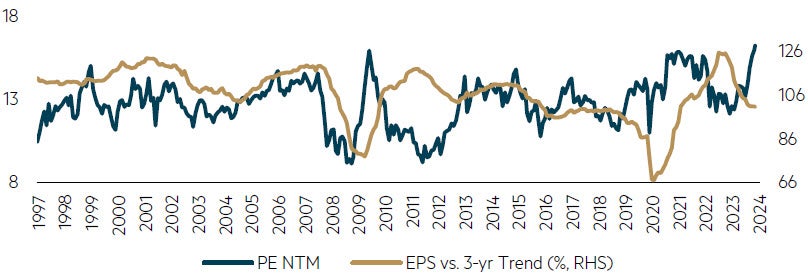
Yet less than a year later, Banks have handsomely outperformed the broader market*. As always, our job is to judge the stocks on what we see before us. Frankly, we believe earnings still look pretty sensible and yes still pretty unexciting. What has changed is the rating. The chart below from Goldman Sachs suggests the Banks are now trading on a P/E of around 16x – a 35 year high. Furthermore, Goldmans also make the point that historically P/Es have expanded when earnings are depressed. Earnings today for the Banks seem pretty close to ‘normal’ – as far as such a concept exists for Banks!
ASX 200 Banks Valuation versus Earnings Trend
Source: FactSet, Goldman Sachs Global Investment Research, March 2024.
So where does that leave us on Banks?
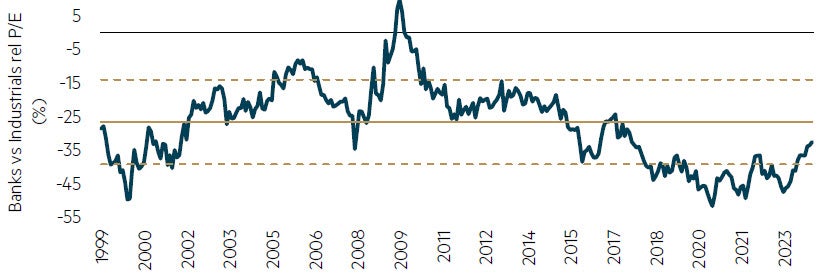
We have been trimming our Bank positions as valuations have become less attractive. The speed of our selling is of course also influenced by other buying opportunities. It is here the story gets more complicated, given Industrials (ex Financials) as a whole still trade at a full ~25x forward earnings**. Thus, relative to Industrials, Banks are closer to fair value rather than outright expensive.
ASX 200 Banks are trading at a 33% discount to industrial PEs, 6% below the 20-year average
Source: Goldman Sachs, March 2024.
The Big Four remain a strong pillar of the Australian economy and make up over 20% of our equity market. While arguably less strategic levers exist for bank boards than did five years ago, we continue to focus on the challenges facing the banking sector, earnings outlook and valuations as share price drivers. As a value-based active manager we will adjust our exposure to the Banks as valuations dictate, just as we have over the last year.
* Performance of S&P/ASX Bank industry group versus S&P/ASX 300 Total Return Index for the year to 29 February 2024.
** Maple-Brown Abbott as at 14 March 2024.
Disclaimer
This article is prepared and issued by Maple-Brown Abbott Limited ABN 73 001 208 564, AFSL 237296 (‘MBA’) as the Responsible Entity of the MBA Australian Value Opportunities Fund (ARSN 091 138 233) (‘Fund’). It does not constitute advice of any kind and should not be relied upon as such. This presentation contains general information only, and does not take into account your investment objectives, financial situation or specific needs. Before making any investment decision, you should seek independent financial advice. This document does not constitute an offer or solicitation by anyone in any jurisdiction. Past performance is not a reliable indicator of future performance.
Any views expressed on individual stocks or other investments, or any forecasts or estimates, are not a recommendation to buy, sell or hold, they are point in time views and may be based on certain assumptions and qualifications not set out in part or in full in this document. Information derived from sources is believed to be accurate, however such information has not been independently verified and may be subject to assumptions and qualifications not described in this document. To the extent permitted by law, neither MBA, nor any of its related parties, directors or employees, make any representation or warranty as to the accuracy, completeness, reasonableness or reliability of this information, or accept liability or responsibility for any losses, whether direct, indirect or consequential, relating to, or arising from, the use or reliance on this information. Units in the Fund mentioned in this presentation are issued by MBA. Before making a decision whether to acquire, or to continue to hold an investment in the Fund or any other securities, investors should obtain and consider the current PDS and Target Market Determination (TMD) or any other relevant disclosure document of those products. For the Fund, the PDS, AIB and TMD are available at maple-brownabbott.com/document-library or by calling 1300 097 995.
This information is current as of 28 March 2024 and is subject to change at any time without notice.
© 2024 Maple-Brown Abbott Limited
Interested in investing with us?
We are a disciplined Australian equities value manager that has been managing Australian equities since we were established in 1984. Over time we have made refinements to our investment process, however our commitment to value investing remains unchanged.