


Media release
2 min
Why retailers are in for a tough 12 months

Australian small caps is a volatile asset class and one for the long-term investor. With recent offshore bank failures and some concerns creeping into credit markets globally, balance sheets and cashflow come into focus, especially at the smaller end of the market where many companies still require funding for growth plans. While we don’t make macroeconomic calls and are by no means suggesting that there will be further issues to come, it is worthwhile exploring how Australian small cap companies are positioned if there is to be another banking crisis, by examining lessons from the Global Financial Crisis (GFC) in 2008.
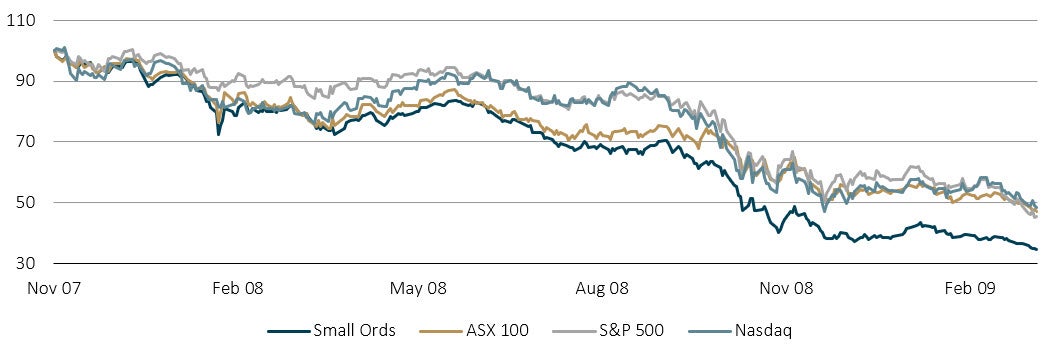
From November 2007 to March 2009, the US markets and the S&P/ASX 100 Index declined 50-55% as a downturn in the US housing market caused significant stress in an over-leveraged financial system, punctuated by the failures of Bear Stearns and Lehman Brothers in 2008. As shown on Chart 1 below, the Australian small caps market significantly underperformed over this period as the S&P/ASX Small Ordinaries Index declined 65%, with most of the underperformance coming through in the later stages of the downturn.
Chart 1. Performance on major indices through the Global Financial Crisis
Source: Factset. 23 March 2023
Two common traits drove the major underperformers in Australian small caps:
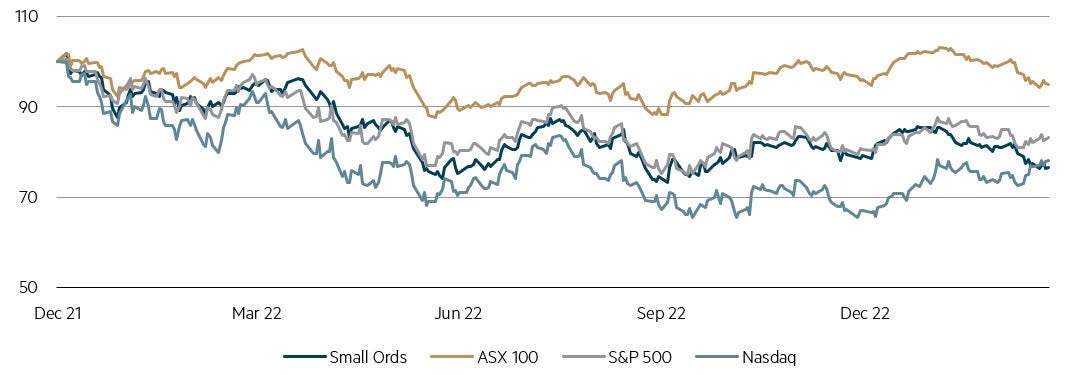
The current downturn since the start of the 2022 calendar year has seen a significant underperformance of Australian small caps compared to large caps, with Australian small caps tracking more in line with US markets. The difficult environment was driven by the financial resolve of central banks around the world to contain elevated inflation levels by tightening financial conditions and increasing interest rates, which has disproportionately impacted perceived ‘higher risk’ asset classes like Australian small caps. On a relative basis, the Australian small cap market has experienced the worst period of underperformance since the GFC and materially underperforming the S&P/ASX 200 Index as risk sentiment took hold and significant valuation compression was experienced by smaller growth companies.
Chart 2. Performance of major indices 2022
Source: Factset. 23 March 2023
Compared to 15 years ago, there are several key differences across the Australian small caps landscape, which in our view should provide better insulation against further underperformance against other equity markets.
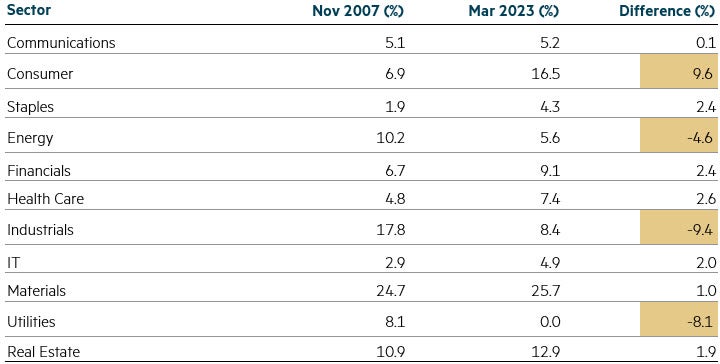
There have been some favourable changes to the S&P/ASX Small Ordinaries Index constituents, notably fewer oil explorers and far less cyclical industrial companies. Many of these companies were among the bottom performers during the GFC as funding dried up and projects were put on hold. Following a wave of mergers and acquisitions in the utilities space over the past decade, there are no utility companies left in the index, with these companies typically carrying high debt levels. Finally at a sector level, there is a greater skew to consumer exposed companies today, however approximately half of this exposure is in more defensive retail categories, including gaming, travel, auto parts, childcare and funeral operators.
Table 1. Sector weights (%) November 2017 vs March 2023
Source: Factset. 23 March 2023
Companies within the Real Estate sector, while facing cap rate expansion and falling valuations, are conservatively geared within a range of ~20-40%, providing some buffer against valuation headwinds. Heading into the GFC many companies in this sector had gearing of between 50-70%, providing little insulation to equity holders.
The COVID period of 2020-2021 saw many companies raise a significant amount of equity to focus on strengthening balance sheets in the event of any pandemic driven issues. What occurred was far more accommodating to many companies, with strong demand leading to record profits, leaving a largely ungeared balance sheet. Conversely, the 2007 period saw many companies take on large levels of debt to battle perceived “lazy balance sheets”, leaving them un-prepared for a liquidity crunch.
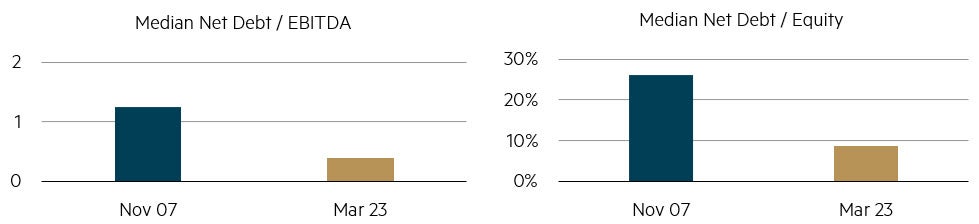
Debt metrics are in far better shape for small cap companies today versus November 2007 as shown in Chart 3 below.
Chart 3. Indicators of balance sheet strength
Source: Factset. 23 March 2023
In November 2007, 47 (or 24%) of stocks in the S&P/ASX Small Ordinaries Index were unprofitable, compared to just 27 (or 13%) today. The median cash holding of small cap companies today is $73m, compared to $36m pre-GFC. In our view, both of these factors should reduce the number of companies that would require a cash injection should trading conditions worsen.
We have focused purely on balance sheet and liquidity metrics in the above sections. However, when considering how stocks and an index will perform, earnings and valuation also need to be factored in. There is no denying that economic headwinds will lead to earnings downgrades across most industries, however the extent and pace of any potential decline is very hard to estimate in advance. Earnings estimates for the S&P/ASX Small Ordinaries Index declined approximately 25% over the GFC period. Valuation is at similar levels today to November 2007 – at around 16.5x P/E based on 12 months forward earnings.
We believe that the changing nature of small cap stocks in the benchmark, stronger balance sheets and liquidity profiles should provide some downside protection for companies and investors in this type of scenario.
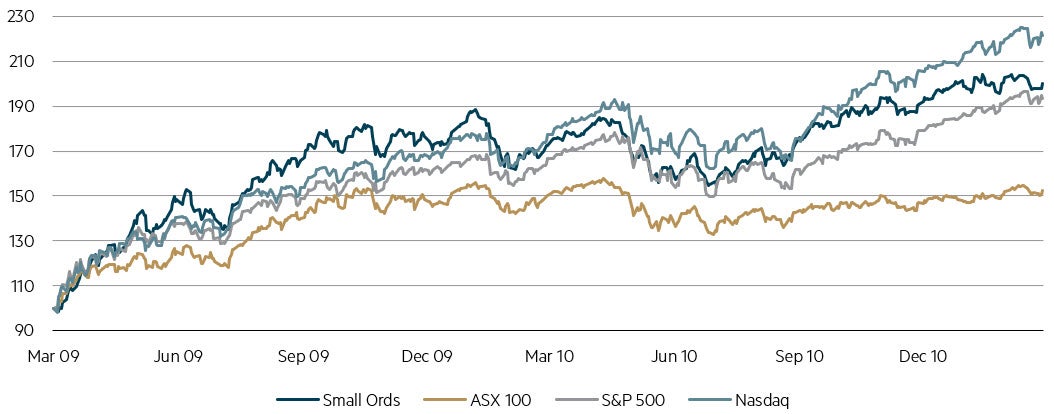
Despite the underperformance leading into the GFC, the Australian small caps market led the recovery over the subsequent two years, substantially outperforming the S&P/ASX 100 Index over this period – leverage can work both ways and investors looking to time the market on the way out may have missed a significant part of this rally.
Chart 4. Performance of major indices post GFC recovery
Source: Factset. 23 March 2023
The Australian small caps market has already experienced a material multiple de-rate recently and while we see earnings being challenged in the near future, Australian small cap market valuations now look attractive relative to other equity classes, notably the Australian large cap market.
Interested in investing with us?
We believe it is through combining our earnings-based valuation approach with a focus on sustainability that the strategy will deliver enhanced investment performance in Australian small companies.