


Flash Note
2 min
The end of the world as we know it

With cracks appearing in parts of the Australian economy amid tighter monetary policy and an increasingly gloomy outlook, investors are once again seeking protection in the so-called ‘defensive’ (or safe-haven) sectors of the Australian sharemarket. Such sectors include infrastructure, utilities, consumer staples – and healthcare.
The Australian healthcare sector accounts for ~10% of the ASX200’s capitalisation, an is dominated by CSL ($140b market capitalisation), along with ResMed ($47b*), Sonic Healthcare ($17b), Cochlear ($16b) and Ramsay Healthcare ($13b). The healthcare sector traditionally commands share price premiums relative to the broader market not only due to defensive characteristics and relatively strong growth forecasts, but also due to an element of scarcity, with only 13 companies represented in the ASX200.
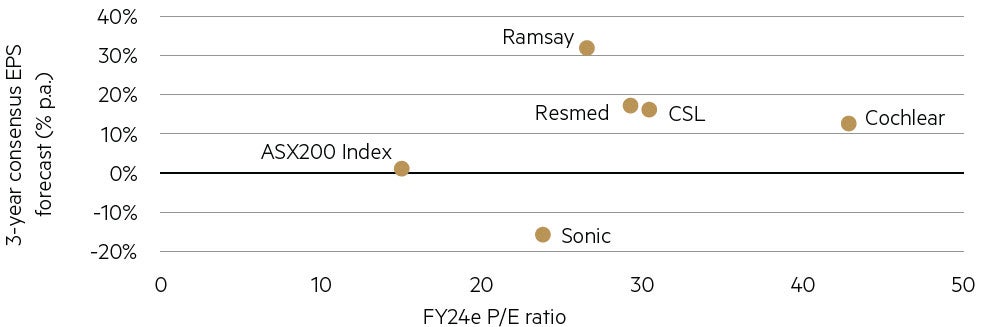
Unlike the major banks and iron ore producers, healthcare comprises a diverse range of companies operating across a range of industries including healthcare equipment and services, pharmaceuticals and biotech. Consequently, the valuation dispersion is wide, however all currently trade at a material premium.
The five largest ASX200 Healthcare companies
Source: FactSet consensus estimates.
The long-term fundamentals of healthcare are compelling: an aging population, rising cases of chronic disease and generally stable funding sources. However, consistent with the broader market, the pandemic brought forward a variety of unexpected and stubbornly persistent challenges. Staffing shortages, cost inflation (including wages, raw materials and consumables), increased collection costs and supply chain disruption have, to varying degrees, driven material earnings downgrades across the sector over the last few years. While a normalisation in demand and supply dynamics is anticipated (as reflected by healthy consensus earnings growth forecasts), recent company trading updates gives an indication that recovery to pre-pandemic levels is generally taking longer than expected to play out.
Accounting for ~6% of the total ASX200 market capitalisation, we believe CSL is a true Australian success story, enjoying a phenomenal track record of organic growth augmented by acquisitions. The company has increasingly diversified away from its core plasma-products related business in recent years through the acquisition of flu-vaccine manufacturer Seqirus, and more recently completed its largest ever acquisition, paying $17b for Swiss renal therapy and iron deficiency products business, Vifor Pharma.
While it is too early to judge the strategic or financial merit of the Vifor transaction, the market clearly has strong faith in the ability of CSL to execute based on its past track record, notwithstanding the fact that since the acquisition of Seqirus in 2015, CSL’s return on invested capital has halved from ~30% to the mid-teens, while gearing has increased from below 1x net debt to EBITDA to ~2.4x. With both Vifor and Seqirus operating in industries with lower multiples than CSL’s core business, delivery of synergy targets will be critical to retaining the company’s premium rating.
In June CSL provided a trading update that fell ~10% short of consensus earnings expectations** for FY24, noting the margin recovery in the core Behring division*** was expected over the “medium term” (i.e. 3–5 years), while competitive challenges to Vifor were intensifying. The stock fell ~10% over the next few days in line with the downgrade. Despite the fall, the premium valuation has been retained and CSL continues to trade at around one standard deviation above its long term (20-year) relative price-to-earnings (PE) average**.
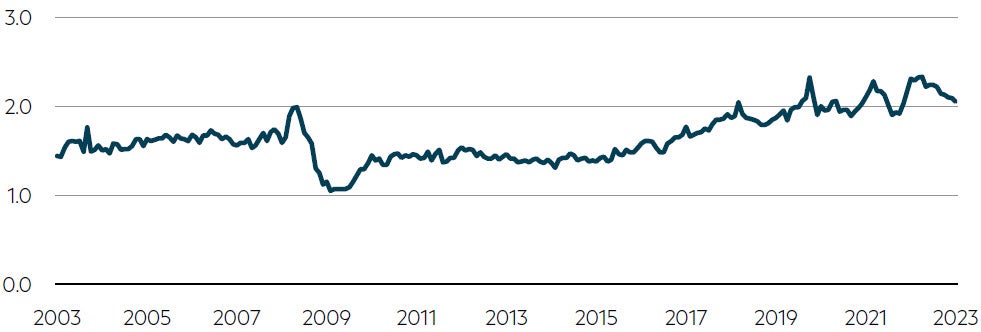
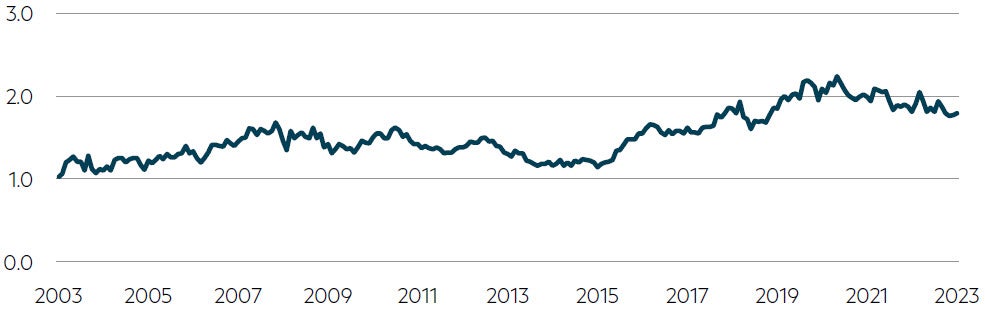
The healthcare sector has historically traded at a significant premium relative to both international comparatives and the broader Australian sharemarket, commanding a >50% premium, on average, over the past 20+ years.
ASX200 Healthcare forward PE relative to ASX200 Total Index forward PE
Source: FactSet, June 2023.
ASX200 Healthcare forward PE relative to MSCI All Countries World Healthcare Index forward PE
Source: FactSet, June 2023.
Over the past five or so years this premium has blown out, increasing to a peak of >130% (relative to the Australian market) in late 2022. Despite the recent retracement the sector remains > one standard deviation premium relative to its history at a >100% premium today.
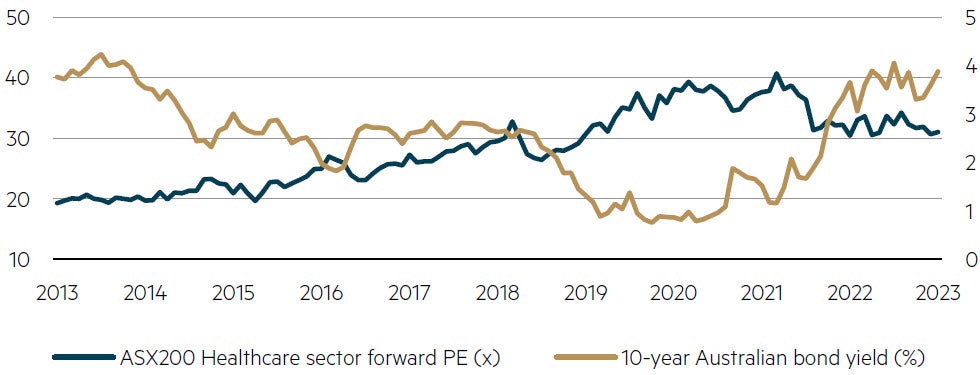
Whether such lofty multiples can be sustained in a higher interest rate environment is one of the big questions facing investors. The chart below shows the inverse relationship between the 10-year domestic bond yield and the ASX200 Healthcare sector valuation, suggesting further risk of a sector de-rating. The last time bond yields were at the current level (~4%) the healthcare sector PE was ~20x, or more than 10 PE points lower than it is today.
Healthcare sector PE vs 10 year Australian Govt Bond rate
Source: FactSet, June 2023.
The Australian listed healthcare sector includes several high-quality companies, some of which have grown to become global leaders in their industries. This strong growth, sustained over many years, has translated into large capitalisations, with CSL now the third largest company listed on the Australian sharemarket. Maintaining high levels of growth as the market currently anticipates from such a high base presents an increasing challenge.
With interest rates now higher by recent standards and gearing generally elevated post the pandemic shock, and valuations still at a significant premium to long term averages, we remain cautious of paying too much for perceived defensiveness – there is a difference between defensive earnings and defensive share prices.
* Total market capitalisation including domestic CDIs + the NYSE listing.
** Source: FactSet, June 2023.
*** Division responsible for plasma-derived and other biotherapies.
Disclaimer
This information was prepared and issued by Maple-Brown Abbott Ltd ABN 73 001 208 564, Australian Financial Service Licence No. 237296 (“MBA”). This information must not be reproduced or transmitted in any form without the prior written consent of MBA. This information does not constitute investment advice or an investment recommendation of any kind and should not be relied upon as such. This information is general information only and it does not have regard to any person’s investment objectives, financial situation or needs. Before making any investment decision, you should seek independent investment, legal, tax, accounting or other professional advice as appropriate, and obtain the relevant Product Disclosure Statement and Target Market Determination for any financial product you are considering. This information does not constitute an offer or solicitation by anyone in any jurisdiction. This information is not an advertisement and is not directed at any person in any jurisdiction where the publication or availability of the information is prohibited or restricted by law. Past performance is not a reliable indicator of future performance. Any comments about investments are not a recommendation to buy, sell or hold. Any views expressed on individual stocks or other investments, or any forecasts or estimates, are point in time views and may be based on certain assumptions and qualifications not set out in part or in full in this information. The views and opinions contained herein are those of the authors as at the date of publication and are subject to change due to market and other conditions. Such views and opinions may not necessarily represent those expressed or reflected in other MBA communications, strategies or funds. Information derived from sources is believed to be accurate, however such information has not been independently verified and may be subject to assumptions and qualifications compiled by the relevant source and this information does not purport to provide a complete description of all or any such assumptions and qualifications. To the extent permitted by law, neither MBA, nor any of its related parties, directors or employees, make any representation or warranty as to the accuracy, completeness, reasonableness or reliability of the information contained herein, or accept liability or responsibility for any losses, whether direct, indirect or consequential, relating to, or arising from, the use or reliance on any part of this information. Neither MBA, nor any of its related parties, directors or employees, make any representation or give any guarantee as to the return of capital, performance, any specific rate of return, or the taxation consequences of, any investment. This information is current at 30 June 2023 and is subject to change at any time without notice. You can access MBA’s Financial Services Guide here for further information about any financial services or products which MBA may provide.
© 2023 Maple-Brown Abbott Limited.
Interested in investing with us?
We are a disciplined Australian equities value manager that has been managing Australian equities since we were established in 1984. Over time we have made refinements to our investment process, however our commitment to value investing remains unchanged.