


Research paper
2 min
Dancing in the dark – When price signals lead investors astray

If ‘unprecedented’ was the financial buzzword of the past two years, we may have a new contender: stagflation. It seems barely a day goes by without a financial commentator raising the “ugly prospect that the world could be facing a period of stagflation”. Looking at equity returns in the 1970s, you would understand why ‘ugly’ is used more often than not to describe stagflation.
At Maple-Brown Abbott, we are in the stock-picking business, not forecasting macroeconomic trends, although we have to be awake to them. We have no insight as to whether stagflation is a remote possibility or a base case, though clearly the odds are rising and a war in the ‘bread basket of Europe’ involving a major energy producer will only increase that risk. We believe it is worth investors considering how stagflation might impact their portfolio should that scenario play out.
While the concept of stagflation is reasonably well understood (a period of low growth but high inflation), there is no widely accepted definition. Does ‘low growth’ actually mean negative real growth (as the Australian economy suffered in 1974 and 1975) or merely growth significantly below trend? Similarly, where do you draw the line on ‘high’ inflation? Consumers, at least in the western world, have become accustomed to deflation in many areas over the past few decades and even relatively modest inflation might come as a shock after years of declining prices.
UBS used two definitions of stagflation in a recent paper(1). The stricter definition (inflation above 3.5% and negative real GDP growth) only resulted in two episodes of stagflation in Australia over the past fifty years: the mid-1970s and early 1980s. Understandably, UBS was reluctant to draw too many conclusions from a sample size of two! They used a broader definition of stagflation to incorporate periods of below-trend growth (they used below 1.5%) and inflation above 3.5%. Using this broader definition, there have been five periods of stagflation in Australia over the past fifty years.
While the UBS paper dealt with many issues, including the point where the equity market bottoms (six months after entering stagflation according to the evidence cited by UBS), what was particularly interesting was the performance of various sectors. The stagflation ‘winners’, at least in a relative sense, included Gold, Telcos and Consumer Staples. While the latter two are proven defensives with some pricing power, Gold is more nuanced. Historically, Gold benefited as a safe haven during times of uncertainty, but additionally the opportunity cost of holding a non-yielding asset fell as real interest rates fell. It will be interesting to see, if indeed we end up in a stagflation environment, whether Gold will again outperform given real interest rates are already negative in most parts of the world.
Of the relative losers, UBS called out Banks and Energy. Ultimately, Banks are leveraged plays on the domestic economy, so it is understandable why they might underperform. Energy is more complicated, UBS suggests, with “the negative economic growth angle overwhelming any positive linkages the sector had to high inflation”. UBS also noted that in periods of high inflation but some growth, Energy was one of the best performing sectors. If that scenario sounds familiar, Energy has been the standout sector, both globally and here in Australia, for this calendar year.
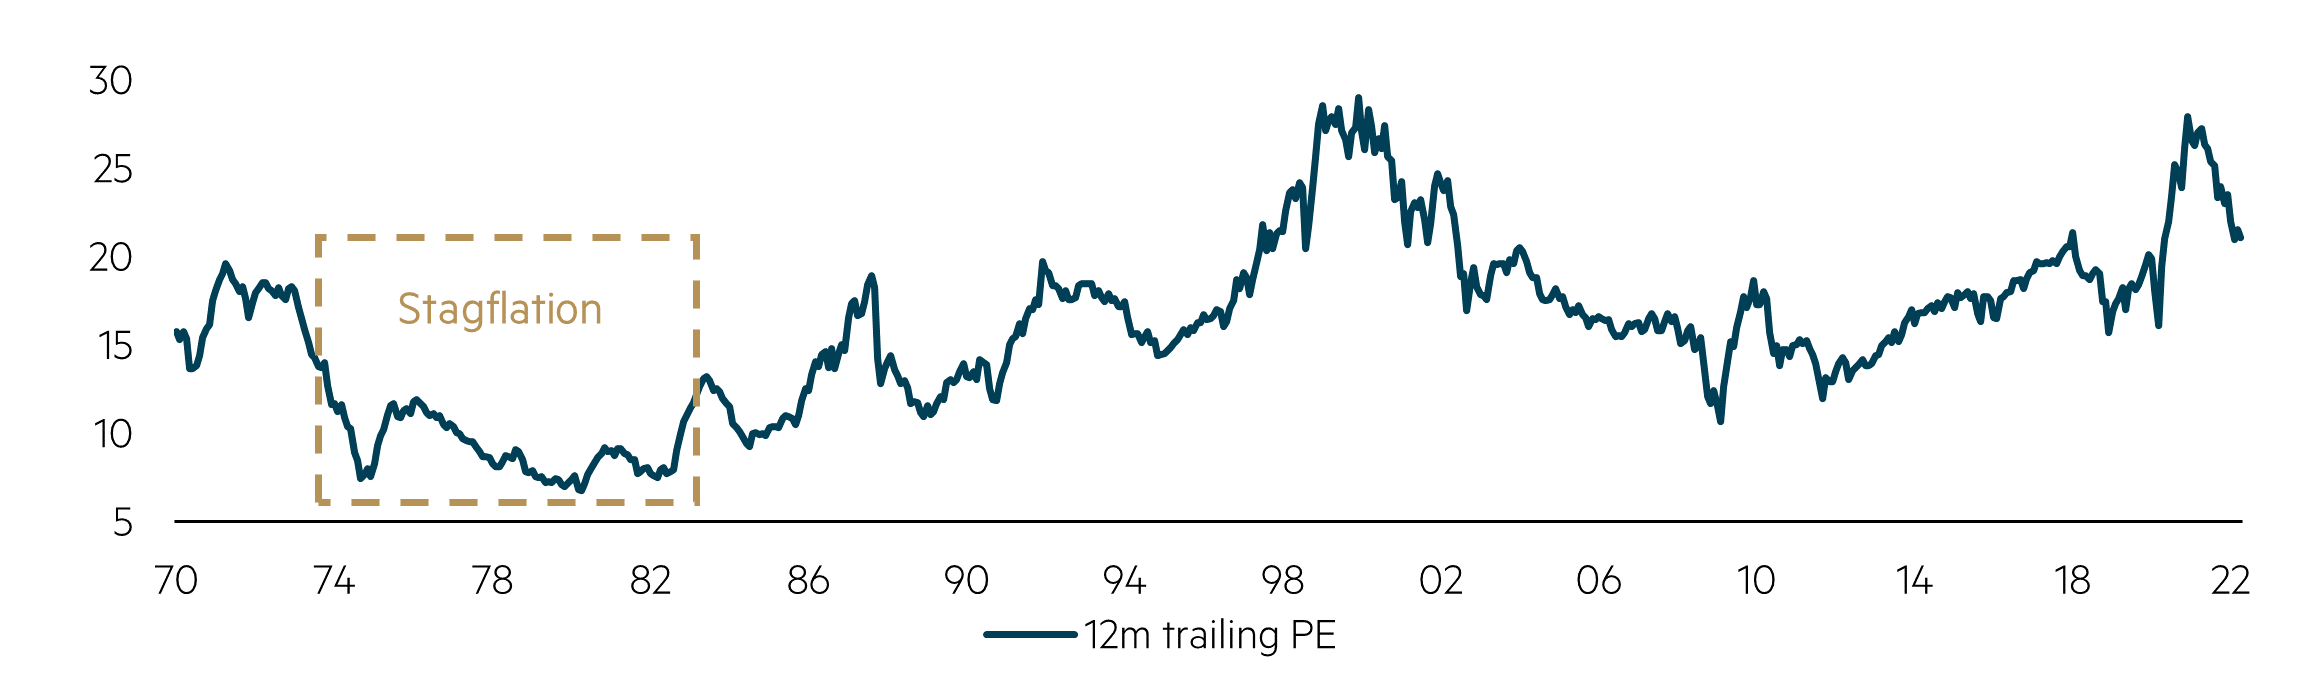
It would be remiss not to have a look at how valuations suffered during periods of stagflation. The following charts, from Goldman Sachs, use US data, given the longer and richer history.
Source: Goldman Sachs Global Investment Research, Australian Outlook report, March 2022
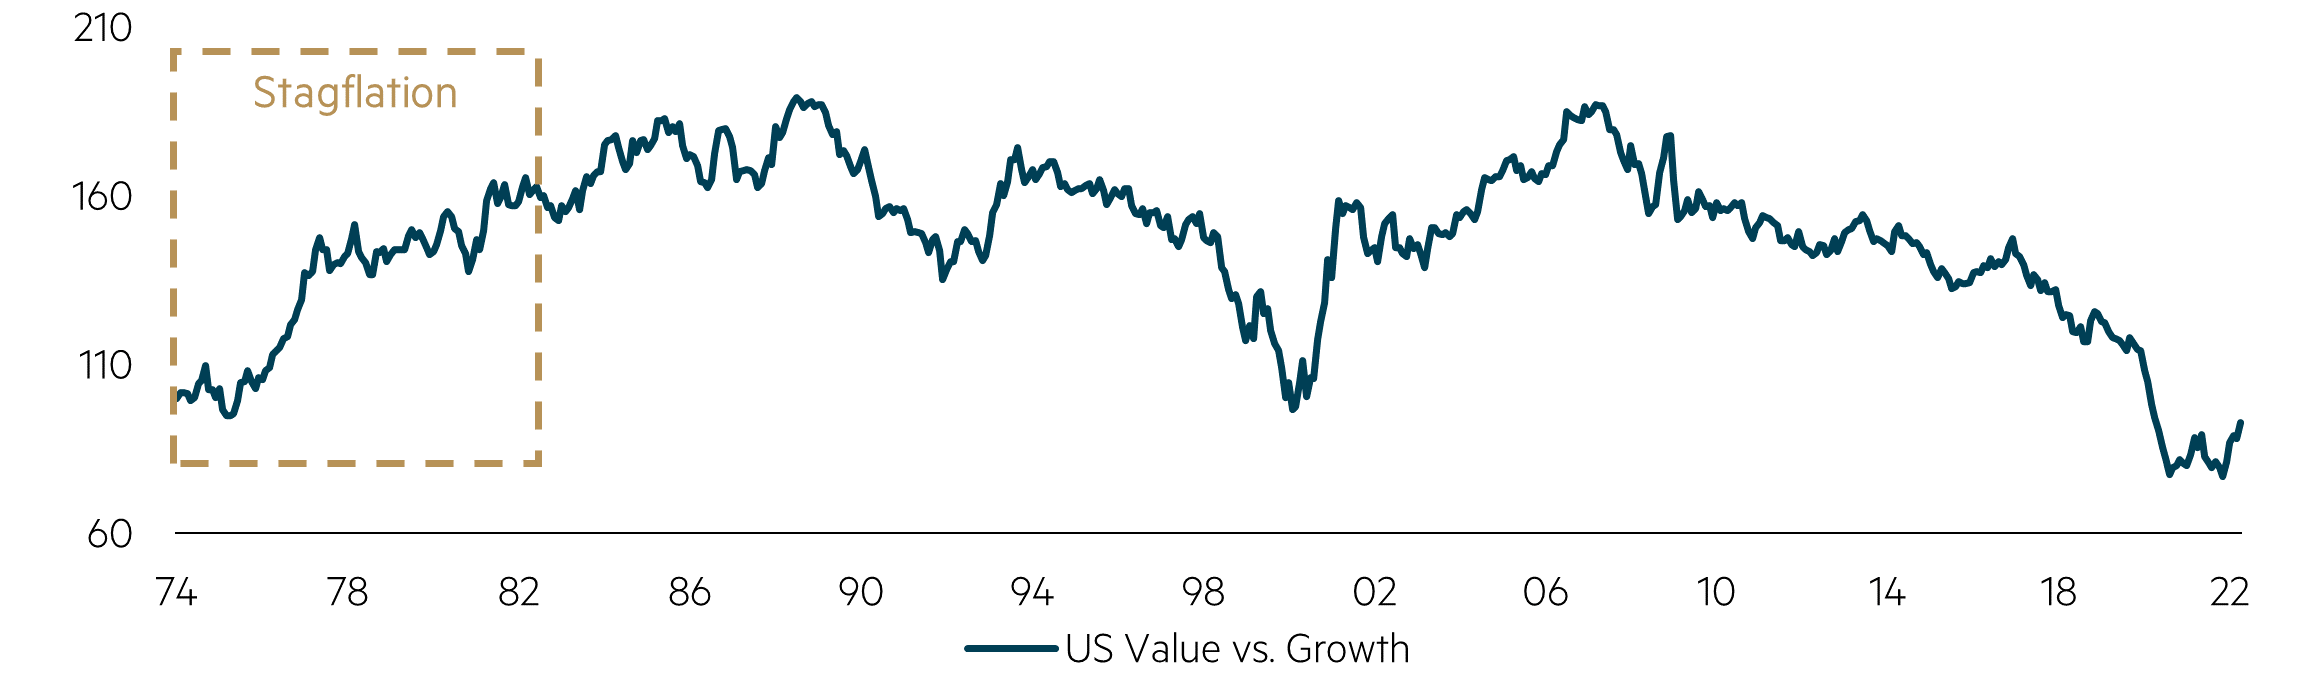
Clearly, the US market endured a significant derating during the stagflation of the 1970s and early 1980s. The US market suffered a 10 point price earnings (‘PE’) fall (from almost 20 times to under 10 times). Largely as a result of this PE derating, Value stocks did significantly better than Growth stocks.
Source: Goldman Sachs Global Investment Research, Australian Outlook report, March 2022
While not wanting to start a stoush between major international broking houses, it should be noted that Goldman Sachs found that Financials (i.e. Banks) and Energy were two of the best performing sectors during this period (remembering that this is US data whereas UBS used Australia). It is not clear why different brokers came to almost diametrically opposite findings, but the different markets (Australia versus the US), different time periods and finally small sample sizes undoubtedly had an impact.
Investors will have their own views as to the likelihood of a period of stagflation. Frankly, it is not something anyone would wish for. However, if that scenario eventuates, history suggests that having a portfolio of reasonably priced Value stocks is likely to fare better than a portfolio of expensive Growth stocks.
1 UBS Australian Equity Strategy, Richard Schellbach, 18 March 2022
Disclaimer
This material was prepared and issued by Maple-Brown Abbott Ltd ABN 73 001 208 564, Australian Financial Service Licence No. 237296 (MBA). MBA is registered as an investment advisor with the United State Securities and Exchange Commission under the Investment Advisers Act of 1940. This information is intended solely for professional and institutional investors and is provided for information purposes only. This material is not intended for, and is not suitable for, retail clients and does not constitute investment advice or an investment recommendation of any kind and should not be relied upon as such. This information is general information only and it does not have regard to any investor’s investment objectives, financial situation or needs. Before making any investment decision, you should seek independent investment, legal, tax, accounting or other professional advice as appropriate. This material does not constitute an offer or solicitation by anyone in any jurisdiction. This material is not an advertisement and is not directed at any person in any jurisdiction where the publication or availability of the information is prohibited or restricted by law. Past performance is not a reliable indicator of future performance. Any comments about investments are not a recommendation to buy, sell or hold. Any views expressed on individual stocks or other investments, or any forecasts or estimates, are point in time views and may be based on certain assumptions and qualifications not set out in part or in full in this information. The views and opinions contained herein are those of the authors as at the date of publication and are subject to change due to market and other conditions. Such views and opinions may not necessarily represent those expressed or reflected in other MBA communications, strategies or funds. Information derived from sources is believed to be accurate, however such information has not been independently verified and may be subject to assumptions and qualifications compiled by the relevant source and this material does not purport to provide a complete description of all or any such assumptions and qualifications. To the extent permitted by law, neither MBA, nor any of its related parties, directors or employees, make any representation or warranty as to the accuracy, completeness, reasonableness or reliability of the information contained herein, or accept liability or responsibility for any losses, whether direct, indirect or consequential, relating to, or arising from, the use or reliance on any part of this material. This information is current as at 31 March 2022 and is subject to change at any time without notice.
© 2022 Maple-Brown Abbott Limited
Interested in investing with us?
We are a disciplined Australian equities value manager that has been managing Australian equities since we were established in 1984. Over time we have made refinements to our investment process, however our commitment to value investing remains unchanged.