


The past three months has been nearly as testing for value managers as the decade to September 2020. Is this a rotation to value or isn’t it? The last quarter of 2020 and the first quarter of 2021 suggested it was, with value stocks significantly outperforming growth stocks. Value managers’ inboxes were being flooded with supportive emails. Value investing was no longer a style on the brink of extinction, it was back in vogue. Then the rotation seemed to hit pause as some of the gains retracted in the June quarter this year. The positive emails stopped. Suddenly it seemed investors had concluded that inflation was going to be a temporary consideration and that economies would deliver a ‘Goldilocks’ mix of solid economic growth, subdued inflation and favourable interest rates. But if this were the case it would be one of the most extraordinary (and unlikely) cycles in recent investment history.
Market poised for significant reversal of extreme cycle
In a decade when momentum has favoured growth stocks and other beneficiaries of continuing lowering of interest rates, the increasing popularity of quantitative related investment strategies has further reduced the role of valuation. After a decade or more of underperformance, value stocks enjoyed a strong six months to the end of March, significantly outperforming growth stocks. However, after stock price moves during the June quarter, the market is pretty much back to the previous extreme valuation differentials between growth and value stocks. It seems fanciful to believe that this would be a platform for the start of a new, sustained growth stock cycle. Instead, Figure 1 suggests markets remain poised for a significant reversal of the extreme cycle of the past decade – much as we saw with the bursting of the Tech Bubble in 2000 and the GFC in 2007/8. The partial reversal during this quarter of value’s gains over the six months to March is in our view nothing more than a pause.
Figure 1: Valuation dispersion is back at record highs
An extremely unlikely starting point for a new cycle for growth

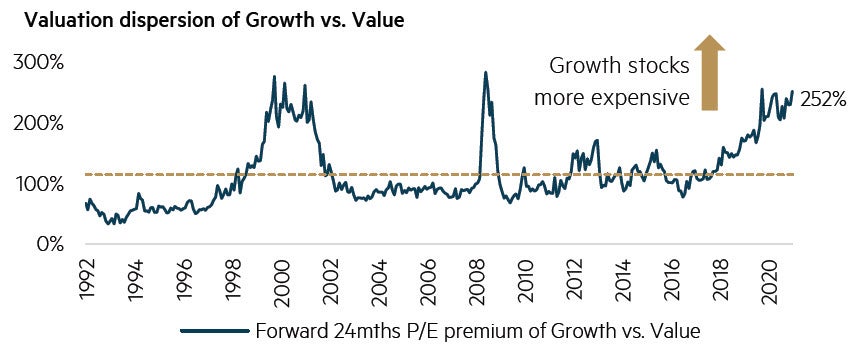
Source: Goldman Sachs, data to June 2021
Beside Beside the valuation spread, there are many other indicators of speculative spirits that have been emboldened by loose monetary policy. Jeremy Grantham(1) points out that there were 480 IPOs in the US in 2020, more than the 406 in 2000. Of the 480, 248 were Special Purpose Acquisition Companies (SPACs) – shells created to take private companies public – which performed extraordinarily well until a recent correction. And then there is the performance of the Goldman Sachs Non-Profitable Technology Index, which was up five-fold over a year, again until a recent correction. Looking beyond stock markets, there are also warning signs of the ongoing dislocation caused by loose monetary policy, nowhere more apparent than in the US ‘junk bond’ market, where investors are, for the first time, happy to accept a negative real rate of interest. This has been a dramatic turnaround from the COVID-related scare which saw real yields soar to ~8%. We are seeing greater uncertainty around upward inflationary pressures than there has been in many year
(1) Waiting for the Last Dance: GMO Viewpoints, 5 January 2021
Figure 2: Speculative spirits rule for now
‘Junk’ bonds priced at a negative real yield

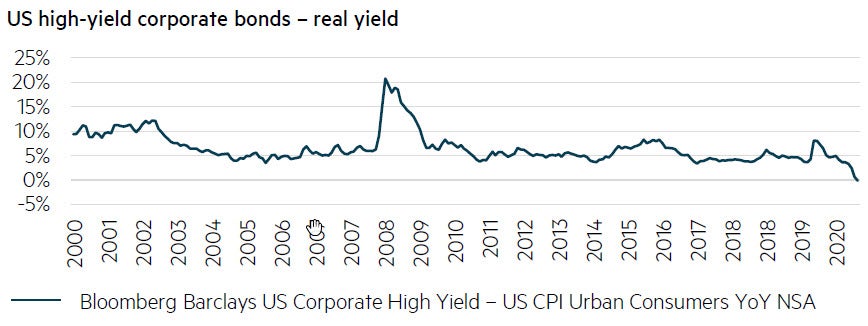
Source: Bloomberg, data to May 2021.
Opportunities for value
Wherever we look we see very strong indicators of the extreme speculative spirit running through most investment markets. We are at the tail end of an historic bull market. You would expect to see excesses everywhere. However, there are always opportunities to be found – usually in the sectors that have been left behind. In the US, tech has been at the forefront. Across global markets, the US has led the way. Across stocks in general, growth has led, leaving everything else in its wake, particularly value. This applies to Australia too. In a market where the average industrial stock is trading on an FY22 price earnings multiple well north of 25x, there are quite large pockets of the market where valuations look far less stretched. Energy is one such sector. This is the case globally too.
The S&P/ASX 300 Energy Index is trading at 20-year lows relative to the rest of the market – even lower than in March 2020, when the Brent oil price was trading in the mid-US$20s. The Brent price at end of this quarter was US$75. As is always the case at extremes, many reasons are offered to justify the severe underperformance of the sector, including the likely impact of the transition away from fossil fuels. While we are certainly in a phase of energy transition, it is difficult to see how major economies get to desired outcomes without gas playing a significant role. Given the uncertainty, we note that capital spend in the oil and gas sector has reduced substantially and the likelihood is that we will see well above-average energy prices for many years should demand continue to remain firm as we expect it to. This will benefit profitability for the sector, which is already trading at record-low profit multiples relative to the market, further enhancing the upside performance potential. We saw a similar situation with the bank sector recently as the sector lost 25% of its value relative to the market over the worst of the pandemic, only to recover that and more as prospects improved and earnings forecasts were upgraded.
Figure 3: Energy stock valuations at record lows relative to Industrials
Earnings upgrades ignored for now

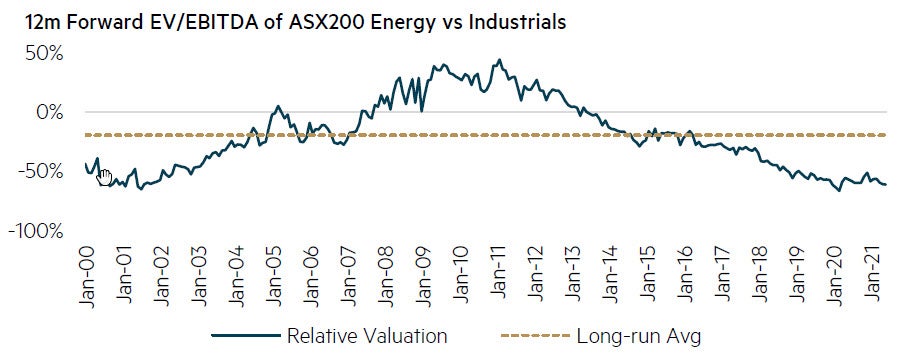
Source: Goldman Sachs, data to June 2021
The combination of record-low valuations and a positive outlook for earnings provides a very attractive mix. It is worth noting that consensus EPS forecasts for the Energy Index for December 2022 have increased by ~20% since the start of 2021 year, while the Index has underperformed the broader market by ~10% over the same period. Energy stocks rank among our highest expected return stocks and thus our client portfolios are well represented in energy and related names. It is also worth highlighting that the performance of energy stocks within the Australian market have lagged global peers during this recovery phase for energy prices
Value style has a long way to run
In summary, we remain of the view that prices for almost every asset class have been bid to extreme levels, on the back of decades of loose monetary policy (and are thus fraught with risk). Monetary policy has largely run its course; hence we have seen the significantly increased emphasis being placed on the role of fiscal policy across major economies. The next decade has to look very different to the last. Since almost all asset classes and prices have been negatively correlated to interest rates – and worse, positively correlated with one another, this will have significant ramifications for investors. The search for assets that will benefit from a positive correlation with interest rates has begun and commodity prices have risen materially. The value style can be expected to benefit from a higher interest rate environment, at least in a relative sense, and it is not surprising that we have seen the start of a long-awaited recovery for the value style. As we saw in the June quarter of 2021, the recovery is unlikely to be smooth and COVID outbreaks may add additional volatility. However, the extreme valuation differentials that exist between stocks give us confidence that there is a long way to go in this process.
Disclaimer
This material was prepared by Maple-Brown Abbott Ltd ABN 73 001 208 564, Australian Financial Service Licence No. 237296 (MBA). MBA is also registered as an investment advisor with the United States Securities and Exchange Commission under the Investment Advisers Act of 1940. This information is intended solely for professional and institutional investors and is provided for information purposes only. This material is not intended for, and is not suitable for, retail clients and does not constitute investment advice or an investment recommendation of any kind and should not be relied upon as such. This information is general information only and it does not have regard to any investor’s investment objectives, financial situation or needs. Before making any investment decision, you should seek independent investment, legal, tax, accounting or other professional advice as appropriate. This material does not constitute an offer or solicitation by anyone in any jurisdiction.
This material is not an advertisement and is not directed at any person in any jurisdiction where the publication or availability of the information is prohibited or restricted by law. Past performance is not a reliable indicator of future performance. Any comments about investments are not a recommendation to buy, sell or hold. Any views expressed on individual stocks or other investments, or any forecasts or estimates, are point in time views and may be based on certain assumptions and qualifications not set out in part or in full in this information. The views and opinions contained herein are those of the authors as at the date of publication and are subject to change due to market and other conditions. Such views and opinions may not necessarily represent those expressed or reflected in other MBA communications, strategies or funds. Information derived from sources is believed to be accurate, however such information has not been independently verified and may be subject to assumptions and qualifications compiled by the relevant source and this material does not purport to provide a complete description of all or any such assumptions and qualifications. To the extent permitted by law, neither MBA, nor any of its related parties, directors or employees, make any representation or warranty as to the accuracy, completeness, reasonableness or reliability of the information contained herein, or accept liability or responsibility for any losses, whether direct, indirect or consequential, relating to, or arising from, the use or reliance on any part of this material. This information is current as at 31 July 2021 and is subject to change at any time without notice.