


Article
2 min
Crowded trades – hiding in plain sight

As value managers we are always on the lookout for ‘value’ stocks. We consider value stocks to be listed companies currently out of favour with the market, often with depressed earnings or trading on low price-earnings (PE) multiples. Such stocks might be cyclical businesses experiencing a temporary downturn or businesses going through a period of operational change. Or, perhaps, businesses for which the market has taken an overly negative view on the outlook or on the underlying value of assets. Despite these traits, on a case-by-case basis we believe such companies can remain fundamentally good businesses with a material possibility of turning things around.
A key aspect of our investment philosophy is that in our view, the market often gets it wrong, and that the price and value of a company may deviate materially in the shorter term. However, in our experience over the longer-term, share prices are more likely to revert to underlying value. We seek to take advantage of this gap in price and value by being patient and disciplined, and believe careful investment in these types of opportunities should generate relatively strong investment performance over time.
With the value investment approach, there is a constant danger of investing in ‘value traps’. These are stocks that look cheap, but are cheap for a reason – and in our experience, will usually continue to get cheaper still. When looking at a stock for potential inclusion in portfolios, we spend substantial time considering this issue and have a process aimed at reducing the risk of investing in value traps. We have identified a range of factors that indicate a heightened risk of a stock being a value trap. Considerations include:
We have developed a scoring system that incorporates these and other factors to help us identify ‘value traps’. As part of our research process, we score all potential investments and – no matter the price – are very wary of companies that score as high risk.
Over the years, we have seen many examples of value traps. Companies in sunset industries are among the classic examples, like print media, coal-fired power generation or old growth logging. Village Roadshow Limited (VRL) is an example of a company that potentially offered value but that in our opinion, turned out to be one to avoid. VRL is the operator of the Village cinema chain, the Roadshow film distribution company and several theme parks, notably Warner Brothers Movie World, Wet’n’Wild and Sea World on the Gold Coast.
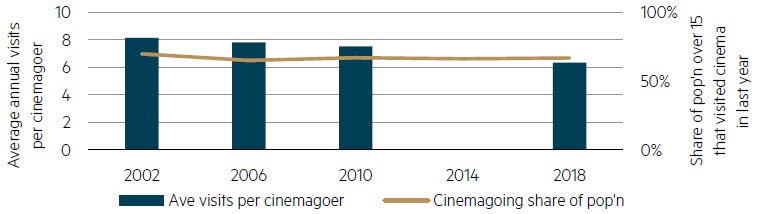
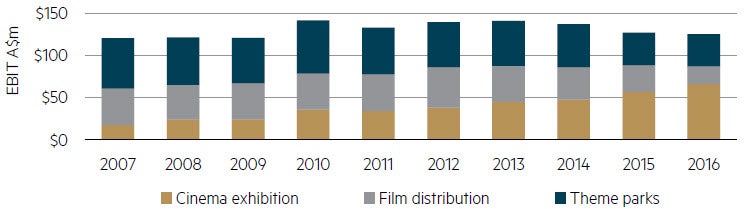
Cinema attendance has been in steady decline around the world for decades. In Australia, the average cinemagoer visited a cinema ten times a year in the 1990s, falling to around six times by 2019. This decline has been due to a shifting preference for other leisure activities, not least an increase in home viewing associated with growth in pay television and more recently the proliferation of streaming services. Despite this headwind, VRL’s cinema business successfully managed to grow earnings until 2016 through a combination of price increases, select growth opportunities and other operational initiatives. Film distribution was tougher, impacted both by declining cinema audiences and a shift to digital, but its earnings still increased until 2012.
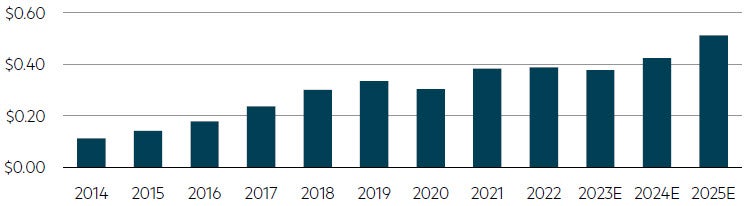
Cinema attendance in Australia
Source: Australian Bureau of Statistics, MBA analysis
CRL segment EBIT (cont. ops ex corp. costs)
Source: Village Roadshow Ltd
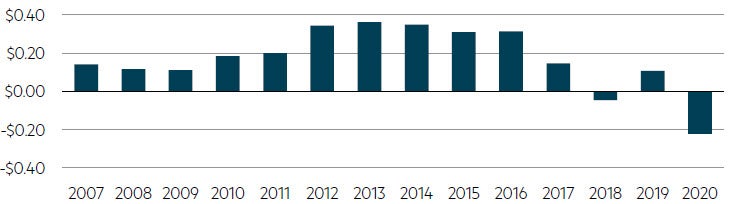
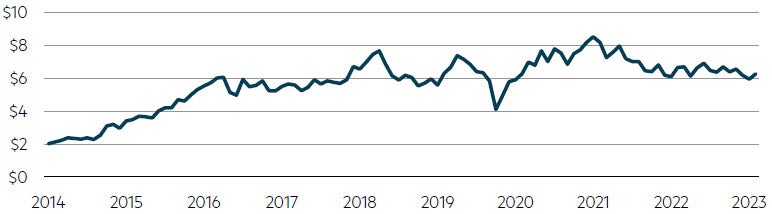
In early 2016, VRL’s stock price fell 15% following a disappointing earnings release in which film distribution and theme parks missed expectations. The stock continued to underperform and by early 2017 was down another 35%. Earnings were holding up, however, with the stock price fall largely reflecting a de-rating from a high teens PE multiple to less than 12x by early 2017. At this point, VRL’s stock price may have looked attractive. However, earnings started falling, including for the cinema business. The theme parks business was also adversely impacted by a tragic accident at competitor Dreamworld. Earnings per share more than halved in 2017. Debt levels had also been rising due to growth investment and weak cashflow. With the key net debt to earnings metric approaching an unacceptable 4x in 2017 and earnings continuing to decline, VRL was forced to sell assets and raise equity to placate its bankers. By 2018, the company was loss making and the stock was trading around $2.00, 75% below its peak. The pandemic was a further blow to the weakened company, forcing closure of cinemas and theme parks for several months and seeing the stock price at one stage fall below $1.
Shareholders were given some reprieve when the company was acquired by private equity firm BGH in 2020 for $3 per share, however, this was still 60% below the peak.* Time will tell how the business will fare in future.
VRL share price
Source: FactSet
VRL earnings per share
Source: Village Roadshow Ltd
VRL exhibited several classic value trap signals. The structural decline in cinema attendance was a key red flag. While companies can stave off the impacts of declining demand for a period through increased pricing or cost reduction, over time such headwinds often become insurmountable. A weak balance sheet was another warning sign, making it less able to withstand its earnings pressures and ultimately forcing asset sales and an equity raising. Finally, we saw insiders selling. The controlling shareholders, the Kirby brothers, reduced their stake in the company from 52% to 44% in early 2013 – right at the time when earnings peaked. These signals, individually and in aggregate, were in our view sufficient reason to not purchase VRL stock – despite the seemingly bargain price at particular times.
By contrast, a value stock currently included in our portfolios is auto parts distributor Bapcor (BAP). Bapcor has materially underperformed the broader sharemarket over the last two years for a range of reasons including some executional issues with a supply chain project, abrupt management change and most recently fear that a recession will impact earnings. Having previously been considered a premium stock with growth potential, the PE multiple has derated materially and at 14x forward earnings is near record lows.
Bapcor share price
Source: FactSet
Bapcor earnings per share
Source: FactSet
While we observe some potential value trap flags, analysis and engagement with the company suggests that execution has improved and management change was not a negative signal. We also see Bapcor as a defensive stock, likely to perform well in a weaker economy, given the majority of sales are for non-discretionary car maintenance. Bapcor’s strong balance sheet is another positive, which should help it handle any unforeseen difficulty. Over time, we expect the market to give it credit for these qualities.
With existing technological and social change, as well as emerging macroeconomic headwinds, we believe that the risk of encountering value traps is high. However, with careful analysis and a good understanding of what to look out for, investors can be well-equipped to avoid them.
* Sources: VRL ASX disclosures, FactSet and MBA analysis, July 2023.
Disclaimer
This information was prepared and issued by Maple-Brown Abbott Ltd ABN 73 001 208 564, Australian Financial Service Licence No. 237296 (“MBA”). This information must not be reproduced or transmitted in any form without the prior written consent of MBA. This information does not constitute investment advice or an investment recommendation of any kind and should not be relied upon as such. This information is general information only and it does not have regard to any person’s investment objectives, financial situation or needs. Before making any investment decision, you should seek independent investment, legal, tax, accounting or other professional advice as appropriate, and obtain the relevant Product Disclosure Statement and Target Market Determination for any financial product you are considering. This information does not constitute an offer or solicitation by anyone in any jurisdiction. This information is not an advertisement and is not directed at any person in any jurisdiction where the publication or availability of the information is prohibited or restricted by law. Past performance is not a reliable indicator of future performance. Any comments about investments are not a recommendation to buy, sell or hold. Any views expressed on individual stocks or other investments, or any forecasts or estimates, are point in time views and may be based on certain assumptions and qualifications not set out in part or in full in this information. The views and opinions contained herein are those of the authors as at the date of publication and are subject to change due to market and other conditions. Such views and opinions may not necessarily represent those expressed or reflected in other MBA communications, strategies or funds. Information derived from sources is believed to be accurate, however such information has not been independently verified and may be subject to assumptions and qualifications compiled by the relevant source and this information does not purport to provide a complete description of all or any such assumptions and qualifications. To the extent permitted by law, neither MBA, nor any of its related parties, directors or employees, make any representation or warranty as to the accuracy, completeness, reasonableness or reliability of the information contained herein, or accept liability or responsibility for any losses, whether direct, indirect or consequential, relating to, or arising from, the use or reliance on any part of this information. Neither MBA, nor any of its related parties, directors or employees, make any representation or give any guarantee as to the return of capital, performance, any specific rate of return, or the taxation consequences of, any investment. This information is current at 1 August 2023 and is subject to change at any time without notice. You can access MBA’s Financial Services Guide here for further information about any financial services or products which MBA may provide. © 2023 Maple-Brown Abbott Limited.
Interested in investing with us?
We are a disciplined Australian equities value manager that has been managing Australian equities since we were established in 1984. Over time we have made refinements to our investment process, however our commitment to value investing remains unchanged.